| . |  |
. |
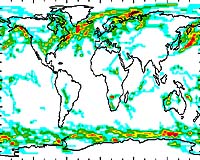
If you're a weather fanatic, or if you've just ever wondered how stormy it was around the world on the day you were born, you can now find out. Scientists working with NASA have created a free on-line atlas that shows extra-tropical storm tracks between 1961 and 1998. "Although the atlas was originally developed for use by climatologists investigating the impact of global warming on storms, the images and data have also been used by fisheries, foreign meteorological services, researchers tracking historic storms, and by teachers and students," said Mark Chandler, a Columbia University geologist at NASA's Goddard Institute for Space Studies (GISS), New York City. The on-line "Atlas of Extra-Tropical Cyclones 1961-1998" plots storm paths and statistics by tracking atmospheric low-pressure centers at sea level. The sea level pressures are calculated using data provided by the National Centers for Environmental Prediction and the National Center for Atmospheric Research (NCEP/NCAR) Reanalysis Project. Fundamental information available about extra-tropical storm systems includes maps of storm frequency and intensity as well as plots of individual storms paths. In addition to the average intensity of storms over time, maps of the "most severe" storms are also calculated. The global maps include individual monthly and seasonal averages for the years 1961 through 1998 and all frequency and intensity maps are available as either rectangular maps or polar projections (which provides a view of the tracks from both north and south poles). If a user chooses to download "Tracks," a grayscale image of the world is presented showing the tracks of all storms for the entire period selected. Together, the images presented in this atlas describe the state of the mid- and high-latitude storm tracks during much of the latter half of the 20th century. In addition to images, the data is also available for download, along with an associated FORTRAN computer program. The program can be used to extract subsets of the database and places the information into report form. The reports identify how long a storm lasted, the latitude and longitude positions of storms at 12-hour intervals, the atmospheric pressure at the storm center (low pressure suggests a storm), as well as the day, month, year and time (Greenwich Mean Time). Currently, NASA is working to update the Atlas to include data through the year 2001 as well as data for the year's 1950 through 1960. A CD-ROM is also available, which includes GIF images of all frequency and intensity maps, and higher resolution postscript images of the grayscale "tracks" maps. Related Links NASA/GISS storm tracks database The NCEP/NCAR Reanalysis Project: SpaceDaily Search SpaceDaily Subscribe To SpaceDaily Express 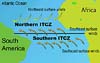 Greenbelt - Jul 16, 2002
NASA's QuikSCAT satellite has confirmed a 30-year old largely unproven theory that there are two areas near the equator where the winds converge year after year and drive ocean circulation south of the equator.
|
| ||||||||||
| The content herein, unless otherwise known to be public domain, are Copyright 1995-2016 - Space Media Network. All websites are published in Australia and are solely subject to Australian law and governed by Fair Use principals for news reporting and research purposes. AFP, UPI and IANS news wire stories are copyright Agence France-Presse, United Press International and Indo-Asia News Service. ESA news reports are copyright European Space Agency. All NASA sourced material is public domain. Additional copyrights may apply in whole or part to other bona fide parties. Advertising does not imply endorsement, agreement or approval of any opinions, statements or information provided by Space Media Network on any Web page published or hosted by Space Media Network. Privacy Statement All images and articles appearing on Space Media Network have been edited or digitally altered in some way. Any requests to remove copyright material will be acted upon in a timely and appropriate manner. Any attempt to extort money from Space Media Network will be ignored and reported to Australian Law Enforcement Agencies as a potential case of financial fraud involving the use of a telephonic carriage device or postal service. |