| . |  |
. |
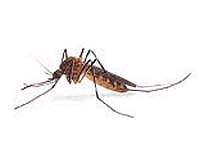
Recently, NASA has contributed weather and climate data to assist Pennsylvania state agencies in their response to the incidence of West Nile Virus throughout the Keystone state. Multiple state agencies in Pennsylvania are working with NASA, the Centers for Disease Control (CDC) and Prevention, and other federal agencies in an environmental and public health alliance that is focusing on responding to the progress of West Nile Virus as it spreads through counties. The PA West Nile Virus Surveillance System (PAWNVSS) provides up-to-date information on where infected mosquitoes, birds and humans have been reported throughout the state. Over the last two years, the Pennsylvania Departments of Environmental Protection (PA DEP), Health (PA DOH), and Agriculture (PDA) built a geographic information system (GIS) with the assistance of Environmental Systems Research Institute (ESRI) software and support, and NASA weather and climate data. The GIS mapping system became a model for collecting data from the field, laboratory and remote sensing images. Those data were combined and used to create a map of the state, with county designations that can indicate which counties West Nile Virus has been reported in. The PAWNVSS system was established so that counties could respond with increased mosquito surveillance and control, pesticide spraying and public notifications whenever the virus was found within their borders. The Pennsylvania DOH collects dead birds; the DEP collects mosquitoes and decides where to spray. "Surveillance data collected from across the state is entered into the web-based database and is used to guide the agencies in making decisions on issuing public health alerts and mosquito control activities," said Eric Conrad of the PA DEP. The PAWNVSS supports data acquisition, laboratory forensics, decision making/response and communications. Decision makers have tools to view and analyze data from various different sources such as environmental and veterinary data. The system also allows the decision makers to communicate with the large numbers of people responding to the same incident. Daily results are posted by the system to both secure and public websites. The secured website is updated at noon daily, and used by 660 users in county governments. On a daily basis at noon, representatives from the PA DEP, PA DOH and PDA review and discuss current activity and then take actions such as larviciding or spraying for adults. By 2 p.m. Eastern daily the data are published on the Public Website: www.westnile.state.pa.us in the form of a map of the state and data tables with county outlines, so people will know where West Nile Virus has been reported. The public can go to the web site and subscribe to daily email alerts from the database that will tell them where West Nile was reported in Pennsylvania the day before. West Nile Virus is a mosquito transmitted disease that, as of Oct 2, has spread to 41 states, with 2530 human cases and 125 deaths. It is transmitted to humans when infected mosquitoes bite them, injecting the virus into the blood. Symptoms begin 3-15 days after infection and can include fever, headache, body aches, and possible rashes, which generally last a few days. More serious cases may develop swelling of the brain with fever, headache, disorientation, muscle weakness, neck stiffness, and may slip into a coma and die. "Our initiative to contain the West Nile Virus is a cooperative effort among several state agencies, as well as the federal Centers for Disease Control (CDC). The help NASA has provided in building this GIS system has been critical," Conrad said. It is hoped that other states may use this database to develop their own systems in the future. The PAWNVSS is an on-going project under the NASA Goddard Space Flight Center's "Healthy Planet" program, part of the larger NASA Public Health Applications Program (PHAP). Related Links PAWNVSS Database Goddard Space Flight Center SpaceDaily Search SpaceDaily Subscribe To SpaceDaily Express 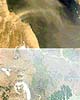 Greenbelt - Sep 19, 2002
Driven by precise new satellite measurements and sophisticated new computer models, a team of NASA researchers is now routinely producing the first global maps of fine aerosols that distinguish plumes of human-produced particulate pollution from natural aerosols.
|
| ||||||||||
| The content herein, unless otherwise known to be public domain, are Copyright 1995-2016 - Space Media Network. All websites are published in Australia and are solely subject to Australian law and governed by Fair Use principals for news reporting and research purposes. AFP, UPI and IANS news wire stories are copyright Agence France-Presse, United Press International and Indo-Asia News Service. ESA news reports are copyright European Space Agency. All NASA sourced material is public domain. Additional copyrights may apply in whole or part to other bona fide parties. Advertising does not imply endorsement, agreement or approval of any opinions, statements or information provided by Space Media Network on any Web page published or hosted by Space Media Network. Privacy Statement All images and articles appearing on Space Media Network have been edited or digitally altered in some way. Any requests to remove copyright material will be acted upon in a timely and appropriate manner. Any attempt to extort money from Space Media Network will be ignored and reported to Australian Law Enforcement Agencies as a potential case of financial fraud involving the use of a telephonic carriage device or postal service. |