| . |  |
. |
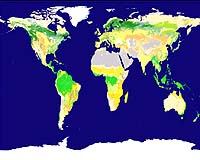
New NASA land cover maps are providing scientists with the most refined global picture ever produced of the distribution of Earth's ecosystems and land use patterns. High-quality land cover maps aid scientists and policy makers involved in natural resource management and a range of research and global monitoring objectives. The land cover maps were developed at Boston University in Boston, Mass., using data from the Moderate Resolution Imaging Spectroradiometer (MODIS) instrument on NASA's Terra satellite. The maps are based on a digital database of Earth images collected between November 2000 and October 2001. "These maps, with spatial resolution of 1 kilometer (.6 mile), mark a significant step forward in global land cover mapping by providing a clearer, more detailed picture than previously available maps," says Mark Friedl, one of the project's investigators. The last maps of this kind were produced from data collected in 1992 and 1993 by the National Oceanic and Atmospheric Administration's Advanced Very High Resolution Radiometer. The MODIS sensor's vantage point of a given location on Earth changes with each orbit of the satellite. An important breakthrough for these maps is the merging of those multiple looks into a single image. In addition, advances in remote sensing technology allow MODIS to collect higher-quality data than previous sensors. Improvements in data processing techniques have allowed the team to automate much of the classification, reducing the time to generate maps from months or years to about one week. Each MODIS land cover map contains 17 different land cover types, including eleven natural vegetation types such as deciduous and evergreen forests, savannas, and wetlands. Agricultural land use and land surfaces with little or no plant cover -- such as bare ground, urban areas and permanent snow and ice -- are also depicted on the maps. Important uses include managing forest resources, improving estimates of the Earth's water and energy cycles, and modeling climate and global carbon exchange among land, life, and the atmosphere. Carbon cycle modeling is linked to greenhouse gas inventories -- estimates of greenhouse emissions from human sources, and their removal by greenhouse gas sinks, such as plants that absorb and store carbon dioxide through photosynthesis. Many nations, including the United States, produce the inventories annually in an effort to understand and predict climate change. "This product will have a major impact on our carbon budget work," says Professor Steve Running of the University of Montana, Missoula, who uses the Boston University land cover maps in conjunction with other weekly observations from MODIS. "With the MODIS land cover product we can determine current vegetation in detail for each square kilometer; for example, whether there is mature vegetation, clear cutting, a new fire scar, or agricultural crops. This means we can produce annual estimates of net change in vegetation cover. This gets us one step closer to a global picture of carbon sources and sinks." This first map is an important milestone, but the land cover mapping group in Boston has other projects in progress. "With data collected over several years," says Friedl, "we will be able to create maps that highlight global-scale changes in vegetation and land cover in response to climate change, such as drought. We'll also be establishing the timing of seasonal changes in vegetation, defining when important transitions take place, such as the onset of the growing season." Launched December 18, 1999, Terra is the flagship of the Earth Observing System series of satellites and is a central part of NASA's Earth Science Enterprise. The mission of the Earth Science Enterprise is to develop a scientific understanding of the Earth system and its response to natural and human- induced changes to enable improved prediction capability for climate, weather, and natural hazards. Related Links More images at Earth Observatory Landcover at Boston University SpaceDaily Search SpaceDaily Subscribe To SpaceDaily Express 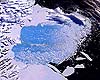 Los Angeles - Apr 18, 2002
NASA instruments flying on the Terra satellite have observed the calving of an iceberg and the breakup of an ice shelf in Antarctica, roughly 2,100 kilometers (1,300 miles) from one another.
|
| ||||||||||
| The content herein, unless otherwise known to be public domain, are Copyright 1995-2016 - Space Media Network. All websites are published in Australia and are solely subject to Australian law and governed by Fair Use principals for news reporting and research purposes. AFP, UPI and IANS news wire stories are copyright Agence France-Presse, United Press International and Indo-Asia News Service. ESA news reports are copyright European Space Agency. All NASA sourced material is public domain. Additional copyrights may apply in whole or part to other bona fide parties. Advertising does not imply endorsement, agreement or approval of any opinions, statements or information provided by Space Media Network on any Web page published or hosted by Space Media Network. Privacy Statement All images and articles appearing on Space Media Network have been edited or digitally altered in some way. Any requests to remove copyright material will be acted upon in a timely and appropriate manner. Any attempt to extort money from Space Media Network will be ignored and reported to Australian Law Enforcement Agencies as a potential case of financial fraud involving the use of a telephonic carriage device or postal service. |