|
|
| . |  |
. |
|
|
by Karen C. Fox for Goddard Space Flight Center Greenbelt MD (SPX) Jan 23, 2013
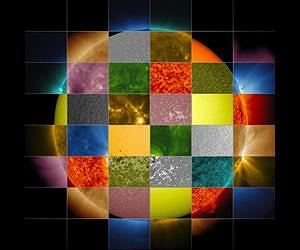
Taking a photo of the sun with a standard camera will provide a familiar image: a yellowish, featureless disk, perhaps colored a bit more red when near the horizon since the light must travel through more of Earth's atmosphere and consequently loses blue wavelengths before getting to the camera's lens. The sun, in fact, emits light in all colors, but since yellow is the brightest wavelength from the sun, that is the color we see with our naked eye -- which the camera represents, since one should never look directly at the sun. When all the visible colors are summed together, scientists call this "white light." Specialized instruments, either in ground-based or space-based telescopes, however, can observe light far beyond the ranges visible to the naked eye. Different wavelengths convey information about different components of the sun's surface and atmosphere, so scientists use them to paint a full picture of our constantly changing and varying star. Yellow light of 5800 Angstroms, for example, generally emanates from material of about 10,000 degrees F (5700 degrees C), which represents the surface of the sun. Extreme ultraviolet light of 94 Angstroms, on the other hand, comes from atoms that are about 11 million degrees F (6,300,000 degrees C) and is a good wavelength for looking at solar flares, which can reach such high temperatures. By examining pictures of the sun in a variety of wavelengths - as is done through such telescopes as NASA's Solar Dynamics Observatory (SDO), NASA's Solar Terrestrial Relations Observatory (STEREO) and the ESA/NASA Solar and Heliospheric Observatory (SOHO) -- scientists can track how particles and heat move through the sun's atmosphere. We see the visible spectrum of light simply because the sun is made up of a hot gas - heat produces light just as it does in an incandescent light bulb. But when it comes to the shorter wavelengths, the sun sends out extreme ultraviolet light and x-rays because it is filled with many kinds of atoms, each of which give off light of a certain wavelength when they reach a certain temperature. Not only does the sun contain many different atoms - helium, hydrogen, iron, for example -- but also different kinds of each atom with different electrical charges, known as ions. Each ion can emit light at specific wavelengths when it reaches a particular temperature. Scientists have cataloged which atoms produce which wavelengths since the early 1900s, and the associations are well documented in lists that can take up hundreds of pages. Solar telescopes make use of this wavelength information in two ways. For one, certain instruments, known as spectrometers, observe many wavelengths of light simultaneously and can measure how much of each wavelength of light is present. This helps create a composite understanding of what temperature ranges are exhibited in the material around the sun. Spectrographs don't look like a typical picture, but instead are graphs that categorize the amount of each kind of light. On the other hand, instruments that produce conventional images of the sun focus exclusively on light around one particular wavelength, sometimes not one that is visible to the naked eye. SDO scientists, for example, chose 10 different wavelengths to observe for its Atmospheric Imaging Assembly (AIA) instrument. Each wavelength is largely based on a single, or perhaps two types of ions - though slightly longer and shorter wavelengths produced by other ions are also invariably part of the picture. Each wavelength was chosen to highlight a particular part of the sun's atmosphere. From the sun's surface on out, the wavelengths SDO observes, measured in Angstroms, are: + 4500: Showing the sun's surface or photosphere. + 1700: Shows surface of the sun, as well as a layer of the sun's atmosphere called the chromosphere, which lies just above the photosphere and is where the temperature begins rising. + 1600: Shows a mixture between the upper photosphere and what's called the transition region, a region between the chromosphere and the upper most layer of the sun's atmosphere called the corona. The transition region is where the temperature rapidly rises. + 304: This light is emitted from the chromosphere and transition region. + 171: This wavelength shows the sun's atmosphere, or corona, when it's quiet. It also shows giant magnetic arcs known as coronal loops. + 193: Shows a slightly hotter region of the corona, and also the much hotter material of a solar flare. + 211: This wavelength shows hotter, magnetically active regions in the sun's corona. + 335: This wavelength also shows hotter, magnetically active regions in the corona. + 94: This highlights regions of the corona during a solar flare. + 131: The hottest material in a flare. For more technical information about which ions produce which wavelengths, roll your mouse over the grid of SDO images below.
Related Links Sun-Earth Science at NASA Solar Science News at SpaceDaily
|
|
| The content herein, unless otherwise known to be public domain, are Copyright 1995-2014 - Space Media Network. AFP, UPI and IANS news wire stories are copyright Agence France-Presse, United Press International and Indo-Asia News Service. ESA Portal Reports are copyright European Space Agency. All NASA sourced material is public domain. Additional copyrights may apply in whole or part to other bona fide parties. Advertising does not imply endorsement,agreement or approval of any opinions, statements or information provided by Space Media Network on any Web page published or hosted by Space Media Network. Privacy Statement |
 del.icio.us
 Digg
Digg Reddit
 Google