| . |  |
. |
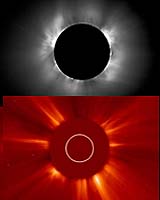
Minimum variance analysis, a widely used data analysis technique, is much less reliable than previously thought to determine the type of an interplanetary magnetic field discontinuity, according to a statistical study based on Cluster data. Published 10 June 2004 in the Journal of Geophysical Research, this result not only provides new constraints for a safer use of this technique, it is a key step to better understand the dynamics of the solar wind. During a total eclipse of the Sun, when for a few minutes the Moon completely covers the Sun's face, a glow appears around the darkened Sun: the solar corona, the Sun's outermost atmosphere (as pictured). The corona, like the Earth's atmosphere, is held down by the Sun's gravity. But the topmost layers are too hot (million degrees) to allow the Sun's gravity to hold on to the gas in these layers. Our Sun is thus continually blowing away charged particles in all directions, mainly electrons and protons. This outward flow of solar particles from the Sun is called the solar wind. Together with solar particles, magnetic fields are also pulled out of the Sun. Indeed, magnetic field lines move with the solar wind plasma (frozen-in theorem) and are stretched. Under the assumptions of this theorem, ions and electrons which start out sharing the same magnetic field line continue to do so later on, as if the line were a deformable wire and the particles beads threaded by it. Imagine a field line extending from the bulk of the Sun to the upper corona. The particles at its "roots" stay with the Sun, but those in the high corona flow out with the solar wind to the Earth's orbit and far beyond. During all this time (under ideal conditions which is a fair approximation), the same field line continues to link both groups. Thus, some solar field lines will extend to the Earth and further out in the heliosphere, producing the Interplanetary Magnetic Field (IMF). Spacecraft measurements in the interplanetary medium revealed the complexity of the solar wind flow and the IMF dynamics. In particular, large changes of the IMF direction occur twice per hour on average and last over tens of seconds. How are they created? What do they tell us about the solar corona? How do they structure the solar wind? Do they have any impact on our Earth magnetosphere? Answering all these questions is of course far beyond the scope of this webstory, however, a key step in answering some of the above questions is to determine what kind of Directional Discontinuities (DDs) are actually observed in space. Two main types of discontinuities are usually referenced. Although observed by various spacecraft (including Ulysses and Voyager 2), the ratio between these two types remains an open question and has been so for more than 35 years. A DD is usually classified either as tangential (TD) or rotational (RD) Magneto-Hydro-Dynamic (MHD) discontinuity. The following properties qualitatively distinguish a TD from a RD: magnitude and density changes can be significant for a TD while small for a RD; the magnetic field component, perpendicular to the plane of discontinuity, Bn, is zero for a TD while non-zero for a RD. Therefore, the estimation of this normal is a key issue to discriminate a DD as rotational or tangential. Before going any further, let's assume that the interplanetary medium is dominated by tangential discontinuities. This would greatly enhance our understanding of the solar wind structure. Indeed, by definition, the magnetic signature of a TD reveals the crossing of two regions magnetically not connected. In other words, when a TD is observed, the local medium is split into two distinct plasma regions, contrary to a RD. A high occurrence of TD implies that the solar wind is formed of many such regions, with no plasma flow between them. The energetic particle diffusion might also be dramatically reduced. When analysing data from a single spacecraft, the discontinuity normal is usually estimated by the Minimum Variance Analysis (MVA). The normal is identified as the direction in which the magnetic field has the least variance (minimum variance). However, no satisfying estimates of the error associated with this method exist so far. Many of the past studies, based on single spacecraft measurements, led to the conclusion that RDs are two times more numerous than TDs [for example Neugebauer, 1984]. Two studies challenged this result by analysing multi-spacecraft observations of DDs [Burlaga and Ness, 1969; Horbury et al. 2001]. Multipoint measurements indeed allow to estimate the discontinuity normal by a more precise technique: the triangulation method, a multipoint data analysis technique. Once a discontinuity is spotted on at least three spacecraft, the relative timings between the spacecraft are used to estimate Bn (see Appendix). Using the triangulation method, the study by Horbury et al. (2001) drew the opposite conclusion to the one found with the MVA technique: more than 2/3 of the DDs are likely to be TDs (the other study was only based on 6 cases). At least three major issues make the validity of this conclusion questionable. 1. Only 41 DDs observed in parallel by three spacecraft have been referenced so far (35 found with GEOTAIL, WIND and IMP8; 6 found with Explorers 33, 34 and 35) 2. The triangulation method assumes that each discontinuity surface can be approximated by a plane thin sheet, over the inter-spacecraft scale. Knowing that this distance ranges from 10 RE to 135 RE (RE=6378 km, the Earth's equatorial radius) for these two sets of spacecraft, the inter-spacecraft distance might not always have fulfilled this assumption. Instead, smaller distances are more likely to fulfil it 3. Using only three spacecraft, a further assumption is required: the directional discontinuity moves with the plasma bulk velocity, measured at one of the spacecraft When four spacecraft are available, the discontinuity speed (solar wind speed plus velocity of propagation in the plasma frame) is determined by triangulation. Since its launch in 2000, the Cluster mission allows, for the first time, to analyse DDs with four spacecraft flying in close formation. 129 DDs, observed by the four Cluster spacecraft, have been found by analysing only 22 days of magnetic field measurements in 2001 (FluxGate Magnetometer experiment, Principal Investigator: Prof. A. Balogh). The inter-spacecraft distance was around 900 km. MVA, the triangulation method and another technique were used to evaluate the RD:TD ratio. "In agreement with single spacecraft observations, the RD:TD ratio is ~ 2 when using MVA. However, not a single proofed RD could be found with the triangulation method!", wrote Thorsten Knetter, lead author on this research, published 10 June 2004 in the Journal of Geophysical Research. Thorsten Knetter conducted this work in the Institut f�r Geophysik und Meteorologie, University of Cologne, Germany. The strong discrepancy between the RD:TD ratio found with the MVA technique and the triangulation method (Image 4) has been carefully looked at and the reason found. This investigation led to: 1. a new criterion to distinguish a RD from a TD when using MVA 2. new conditions for a safe use of MVA. This latter result is of great interest not only for scientists working on magnetic field discontinuities. MVA is a widely spread technique among numerous scientific communities. Contrary to Horbury et al. (2001), this study by Knetter et al. (2003) does not conclude that DDs are mostly TDs. Only 16% are classified unambiguously as TDs, when a significant change in the field magnitude occurs. "DDs could still be RDs with a small but finite Bn. Further analysis considering plasma parameters, for example, changes in velocity and density across discontinuities, has to be done", foresees Knetter. In the near future, the analysis of Cluster measurements at all separation scales from 100 km to 5000 km, and even 10 000 km in the coming years, shall further illuminate our knowledge on the generation and the dynamics of the solar wind. Knetter, T., F. M. Neubauer, T. Horbury and A. Balogh (2004), Four-point discontinuity observations using Cluster magnetic field data: A statistical survey, J. Geophys. Res., 109, A06102, doi:10.1029/2003JA010099
Appendix Triangulation method to estimate a magnetic discontinuity normal Assuming that (1) each discontinuity surface can be approximated by a thin sheet (1D-structure) and that (2) the speed of the discontinuity is constant in time and space over the spacecraft separation distance, the orientation is simply given by R1� n = vnt1 (Russell et al, 1983). Here vn is the DD normal velocity, R1 = (r12,r13,r14) is a tensor with rij being the difference vectors of the four spacecraft positions and t1 = (t12,t13,t14)consists of the time differences between the corresponding spacecraft. Using only three spacecraft Burlaga and Ness (1969) and Horbury et al. (2001) had to assume that the 1D discontinuity moves with the plasma bulk velocity measured at one of the spacecraft. The normal orientations calculated by Horbury et al. (2001) were estimated to be accurate to ~ 20o. If four spacecraft are available the discontinuity speed (solar wind speed plus velocity of propagation in the plasma frame) is determined by triangulation. Using the four Cluster spacecraft, the normal orientations calculated by Knetter et al. (2004) were estimated to be accurate to ~ 10o. Related Links SpaceDaily Search SpaceDaily Subscribe To SpaceDaily Express  Greenbelt MD (SPX) Nov 15, 2004
Millions of people around the world were treated to a brilliant display of aurora lights this week. The Sun produced at least five major "halo" coronal mass ejections (CMEs) over the period of Nov. 4-8, an unusually fast pace for solar activity.
|
| ||||||||||
| The content herein, unless otherwise known to be public domain, are Copyright 1995-2016 - Space Media Network. All websites are published in Australia and are solely subject to Australian law and governed by Fair Use principals for news reporting and research purposes. AFP, UPI and IANS news wire stories are copyright Agence France-Presse, United Press International and Indo-Asia News Service. ESA news reports are copyright European Space Agency. All NASA sourced material is public domain. Additional copyrights may apply in whole or part to other bona fide parties. Advertising does not imply endorsement, agreement or approval of any opinions, statements or information provided by Space Media Network on any Web page published or hosted by Space Media Network. Privacy Statement All images and articles appearing on Space Media Network have been edited or digitally altered in some way. Any requests to remove copyright material will be acted upon in a timely and appropriate manner. Any attempt to extort money from Space Media Network will be ignored and reported to Australian Law Enforcement Agencies as a potential case of financial fraud involving the use of a telephonic carriage device or postal service. |