| . |  |
. |
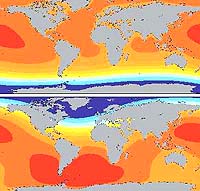
Toronto - Feb. 21, 2001 Global climate change is having a direct impact on the Earth's sea level and a group of scientists led by two U of T geophysicists is providing the sea level "fingerprints" of polar ice sheet melting to prove it. Rates of sea level change over the last century vary widely from one geographic location to another even after these rates have been corrected for known effects. The question has always been, why? What is causing these significant variations? Jerry Mitrovica, U of T geophysics professor, is lead author of a paper to appear in the Feb. 22 issue of Nature that claims to have discovered the answer. And it is an answer that has an important impact on the debate over global climate change. Mitrovica and his colleagues argue that scientists have not widely appreciated that melting from the Antarctic, for example, will have a distinctly different pattern or fingerprint in how it affects sea level than melting from Greenland or small mountain glaciers. It is these patterns that are causing the variation in the global sea level rise. "We calculated these fingerprints using computer models and then showed that the observed record of sea level change displays the fingerprints," says Mitrovica. "Sea level is rising, and based on our work and the analysis of sea level data, not only can we assess the total amount melting from the ice caps, but we can also tell where that meltwater is coming from." Mitrovica conducted this research with Mark Tamisiea, a U of T post-doctoral fellow and second author on the paper, James Davis of the Harvard-Smithsonian Center for Astrophysics, and Glenn Milne of the University of Durham. "In the past, people have been puzzled by the significant variations in sea levels in different parts of the world," says Mitrovica. "Like throwing water in a bathtub, many scientists assumed that if polar ice melting were contributing to sea level rise, it would present itself evenly and uniformly across the Earth's oceans." And that assumption, he says, is simply wrong. Mitrovica uses Greenland as an example. It was assumed that if the ice caps on Greenland were melting, all coastal locations would flood evenly. "In fact," he continues, "if the entire Greenland ice cap melted, then places relatively close by, like Britain and Newfoundland, would actually see sea levels fall. The reason is fairly simple: despite its small size, the Greenland ice sheet exerts a strong gravitational pull on the seas. "As the polar sheet melts, it will exert less pull, resulting in lower - not higher - sea levels around Greenland. Of course, sea levels will rise on average, and as the meltwater moves away from Greenland it will create problems for countries in the Southern Hemisphere. "In the same way, melting from the Antarctic will raise sea levels in the Northern Hemisphere, but not in places like Australia," explains Mitrovica. To look for evidence of their ideas, the scientists re-examined the data from tide gauges that measure sea levels. The results startled even them. They found that they could fit nearly all the geographic variations in sea level that they saw in these tide gauges using the distinct sea level patterns they predicted for the melting of polar ice sheets. It is estimated that sea levels are rising, on average, by about 1.8 millimetres per year. "We've really strengthened the link between today's sea level changes and ice melting and we've found a way of unraveling the details of this link. "By doing that, we've also strengthened extrapolations being made for the future effect of climate warming. And these extrapolations show continued acceleration of sea level rise late into the present century, leading to more flooding of coastal communities," added Mitrovica. Janet Wong is a news services officer with the Department of Public Affairs. Related Links U of T Department of Physics SpaceDaily Search SpaceDaily Subscribe To SpaceDaily Express  San Francisco - Feb. 17, 2001
Climate always changes and what we are used to today is about as stable as climate gets, according to a Penn State glaciologist who has investigated climate records from both poles. Storm Surges Will Increase As Oceans Expand  Hobart - Feb. 7, 2001
Ocean warming and thermal expansion will be the largest contributor to sea-level rise during the 21st century, says Dr John Church, a scientist at CSIRO Marine Research and the Antarctic Cooperative Research Centre. Coastal storm surges will become an increasing threat to life and property, says Dr Church. Climate Change Has Been Impacting Civilization Since Last Ice Age Ended  Amherst - Jan. 25, 2001
Sudden climate changes may have been a major factor in the collapse of several societies during the past 10,000 years, according to a study by a team of researchers with ties to the University of Massachusetts. A One-stop Shop For Ice Core Data  Washington - Jan 24, 2001
Data from ice cores from glaciers and mountain summits allow scientists a glimpse into the frozen past, providing valuable information about the global climate that existed in recent years and thousands of years ago.
|
| ||||||||||
| The content herein, unless otherwise known to be public domain, are Copyright 1995-2016 - Space Media Network. All websites are published in Australia and are solely subject to Australian law and governed by Fair Use principals for news reporting and research purposes. AFP, UPI and IANS news wire stories are copyright Agence France-Presse, United Press International and Indo-Asia News Service. ESA news reports are copyright European Space Agency. All NASA sourced material is public domain. Additional copyrights may apply in whole or part to other bona fide parties. Advertising does not imply endorsement, agreement or approval of any opinions, statements or information provided by Space Media Network on any Web page published or hosted by Space Media Network. Privacy Statement All images and articles appearing on Space Media Network have been edited or digitally altered in some way. Any requests to remove copyright material will be acted upon in a timely and appropriate manner. Any attempt to extort money from Space Media Network will be ignored and reported to Australian Law Enforcement Agencies as a potential case of financial fraud involving the use of a telephonic carriage device or postal service. |