| . |  |
. |
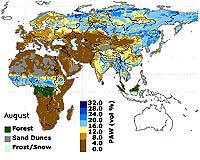
A new way of using data from satellite-based radar is providing scientists with a unique insight into the effects of climate change on ice caps, plant life and land surface. As ESA's Mark Drinkwater explained "for the first time, in this scatterometer climate-record pathfinder study, we have generated a consistent, long-term global microwave radar data set. With this data, scientists will be able to monitor long-term trends over the entire land surface of the Earth. Importantly, we have assembled data from a variety of satellites, going back to the late 1970s, with which one can begin to piece together a clear picture of global change over decades." The new technique, pioneered by Drinkwater and colleague David Long of Brigham Young University, United States uses data gathered by a wind scatterometer -- a radar instrument carried aboard ERS-1 and 2. The scatterometer sends out a radar pulse and measures the characteristics of the echo that bounces back from the planet's surface below. Originally designed to monitor ocean winds by the distinctive echoes from the waves they whipped up on the sea surface, the scatterometer is proving much more versatile. "We've been doing a lot of work looking at polar ice," explains Drinkwater, "but now we're starting to understand how the radar echo is affected by different types of vegetation and soil moisture levels over land, which opens up valuable new opportunities to look at how ecosystems change with time." Although the scatterometer does not provide the kind of high-resolution almost-photographic images produced by synthetic aperture radar (SAR), for Drinkwater's studies it has several advantages. "This project was born out of the frustration of not knowing what was happening between the sporadic images you might get from SAR," admits Drinkwater. "If you can only access infrequent irregularly-spaced images, it's very hard to study change over time, particularly in high-latitude regions where the surface can change dramatically over a short period of time. Now we can combine the two and use the SAR imagery to zoom in on specific events and locations in our global time series." Scatterometer data, with a much wider field of view than SAR, provides a global picture of the land surface every few days with ERS-1 and -2, and with seawinds on Quikscat daily." Because the orbits converge over the poles, at high latitudes we can do even better," explains Drinkwater, "and start to study the melting and refreezing of ice and snow, for example, through the course of each day." The scatterometer echo can, in effect, peer a little way beneath the surface, detecting the type of vegetation, the amount of water in the soil, or the melting and refreezing of seasonal permafrost in the tundra. "We're getting a week-to-week, month-to-month and year-to-year perspective of how the surface is changing," comments Drinkwater. "In a study led by Prof. Wolfgang Wagner of Vienna University of Technology, ERS Scatterometer data has been used to track the 'green wave' in Africa -- the explosion of plant growth in semi-arid terrain as the rainy season comes. The scatterometer first picks up the increase in topsoil humidity and plant-available water, followed by the change in the vegetation cover as leafy plants spring up and bloom. The results of this work are being evaluated in connection with crop yield assessments by the Food and Agriculture Organisation of the United Nations. In addition, the method has been extended to Asia, where snow melt, and the freezing and thawing of the permafrost can be monitored in addition to the soil moisture". The extent of permafrost, for example, is thought to be a particularly sensitive indicator of climate variability. Understanding the changes of such key global climate change indicators is the main justification for the work of Drinkwater and his colleagues in compiling this new data source. "The scatterometer is extremely well calibrated and its long-term performance well-characterised" explains Drinkwater, "so it is very sensitive to small changes over time. This sensitivity, combined with our ability to put together a series of snapshots covering the globe every few days over a period of decades, adds up to a uniquely capable resource for monitoring the effects of climate change -- which could be the most important environmental issue facing our planet and all the people on it." Related Links Land Surface Observations using the ERS Wind Scatterometers Evaluation of Operational Land Applications of Scatterometers Detecting Soil Thawing in Siberia Radar Remote Sensing Vienna University of Technology Brigham Young University Center for Remote Sensing ERS SpaceDaily Search SpaceDaily Subscribe To SpaceDaily Express  Boston - June 25, 2001
Linking vegetation models to climate models when forecasting past and future climates could make climate predictions more accurate and provide a better picture of the effects of global warming on the Earth, according to Penn State researchers.
|
| ||||||||||
| The content herein, unless otherwise known to be public domain, are Copyright 1995-2016 - Space Media Network. All websites are published in Australia and are solely subject to Australian law and governed by Fair Use principals for news reporting and research purposes. AFP, UPI and IANS news wire stories are copyright Agence France-Presse, United Press International and Indo-Asia News Service. ESA news reports are copyright European Space Agency. All NASA sourced material is public domain. Additional copyrights may apply in whole or part to other bona fide parties. Advertising does not imply endorsement, agreement or approval of any opinions, statements or information provided by Space Media Network on any Web page published or hosted by Space Media Network. Privacy Statement All images and articles appearing on Space Media Network have been edited or digitally altered in some way. Any requests to remove copyright material will be acted upon in a timely and appropriate manner. Any attempt to extort money from Space Media Network will be ignored and reported to Australian Law Enforcement Agencies as a potential case of financial fraud involving the use of a telephonic carriage device or postal service. |